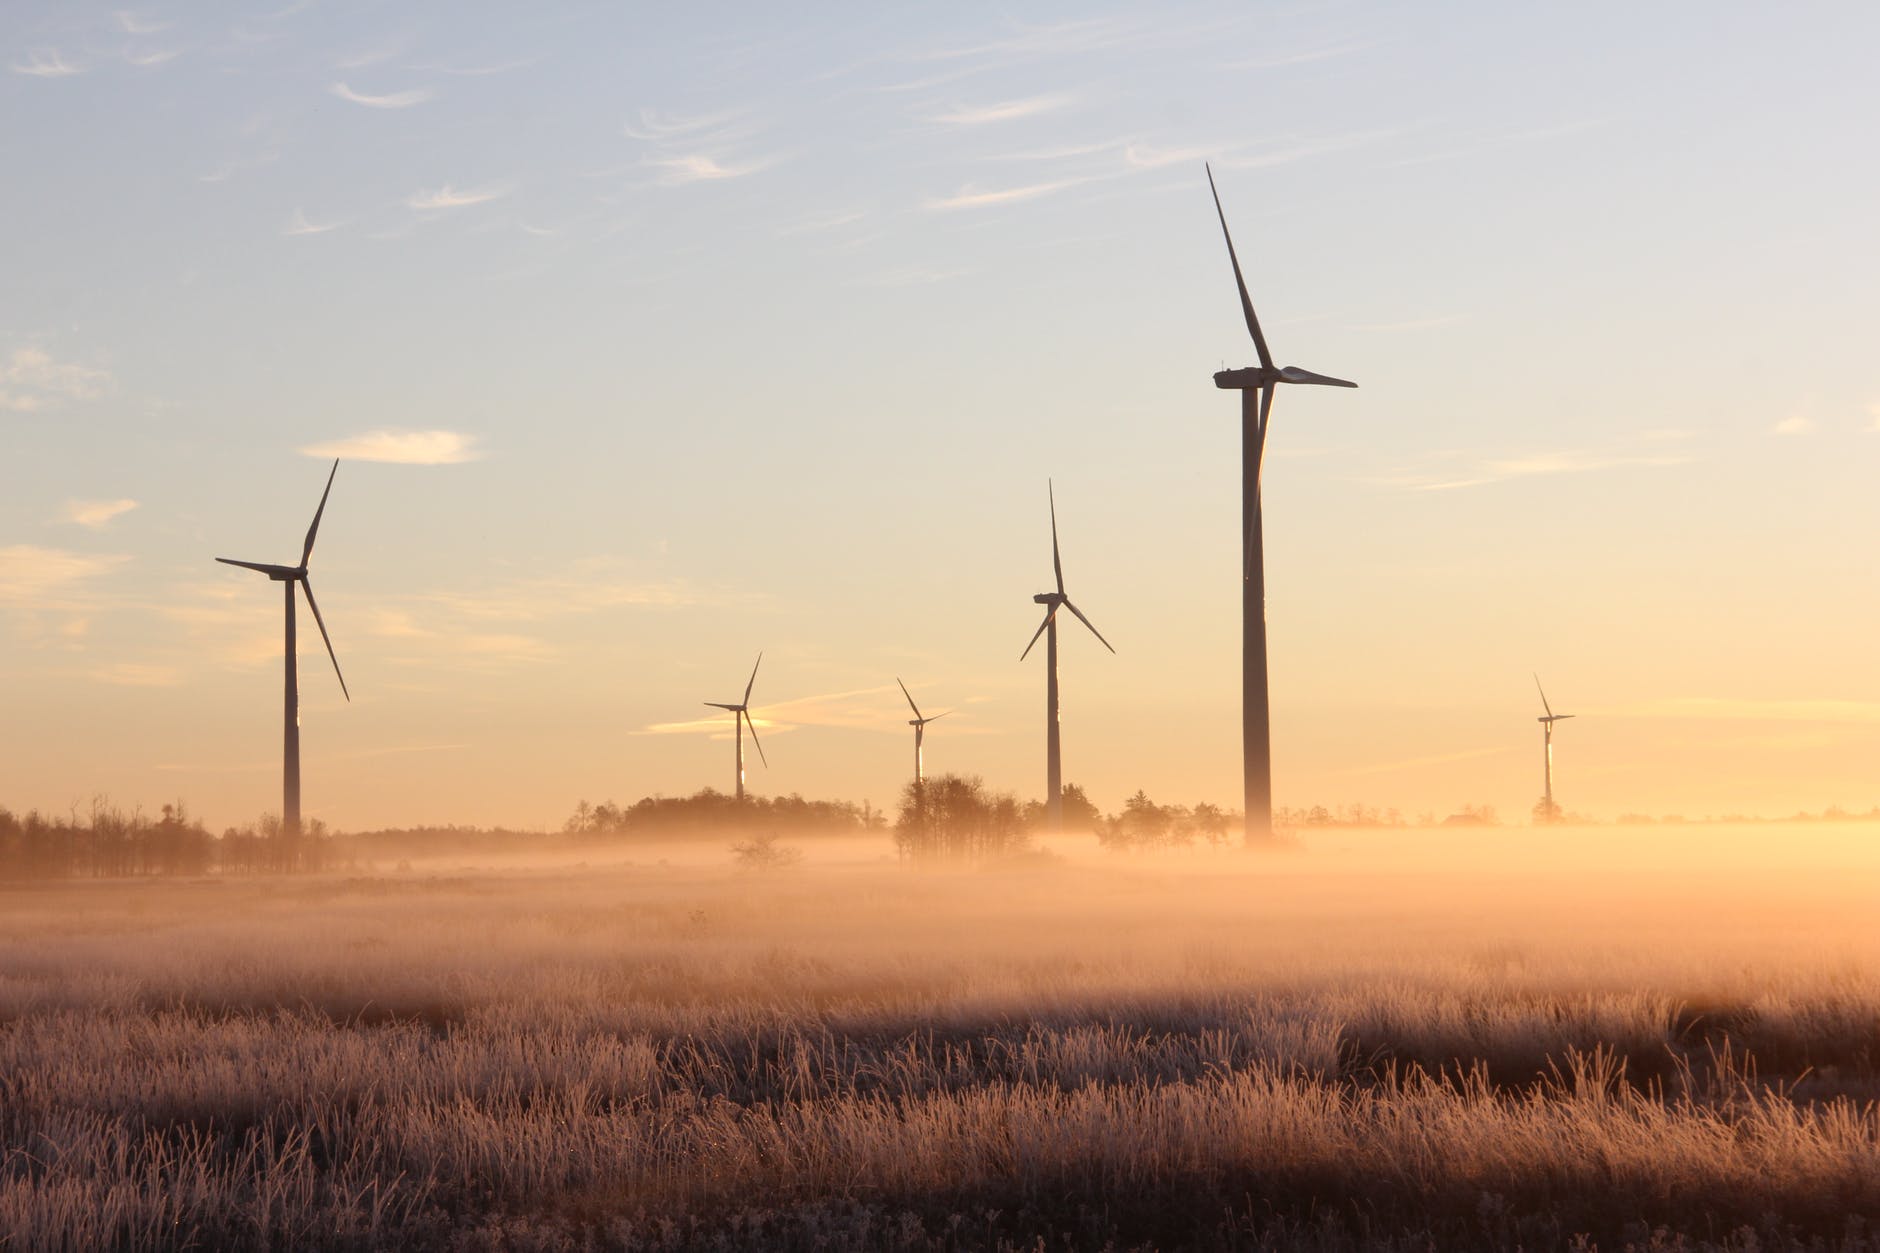
The dashboard comprises of data for windmills from Toitū Te Whenua Land Information New Zealand. Also added regional boundaries from Stats NZ.
Just to make it a bit interesting and structured, we have listed a couple of tasks to be completed. Head to the Tableau Public link and copy the dashboard to start practising.
If you have any suggestions for next week’s DiD data then just drop a line and we will try our best to make it happen. Feel free to contact me here or via email at [email protected]